Live Data Insights
At Your Fingertips
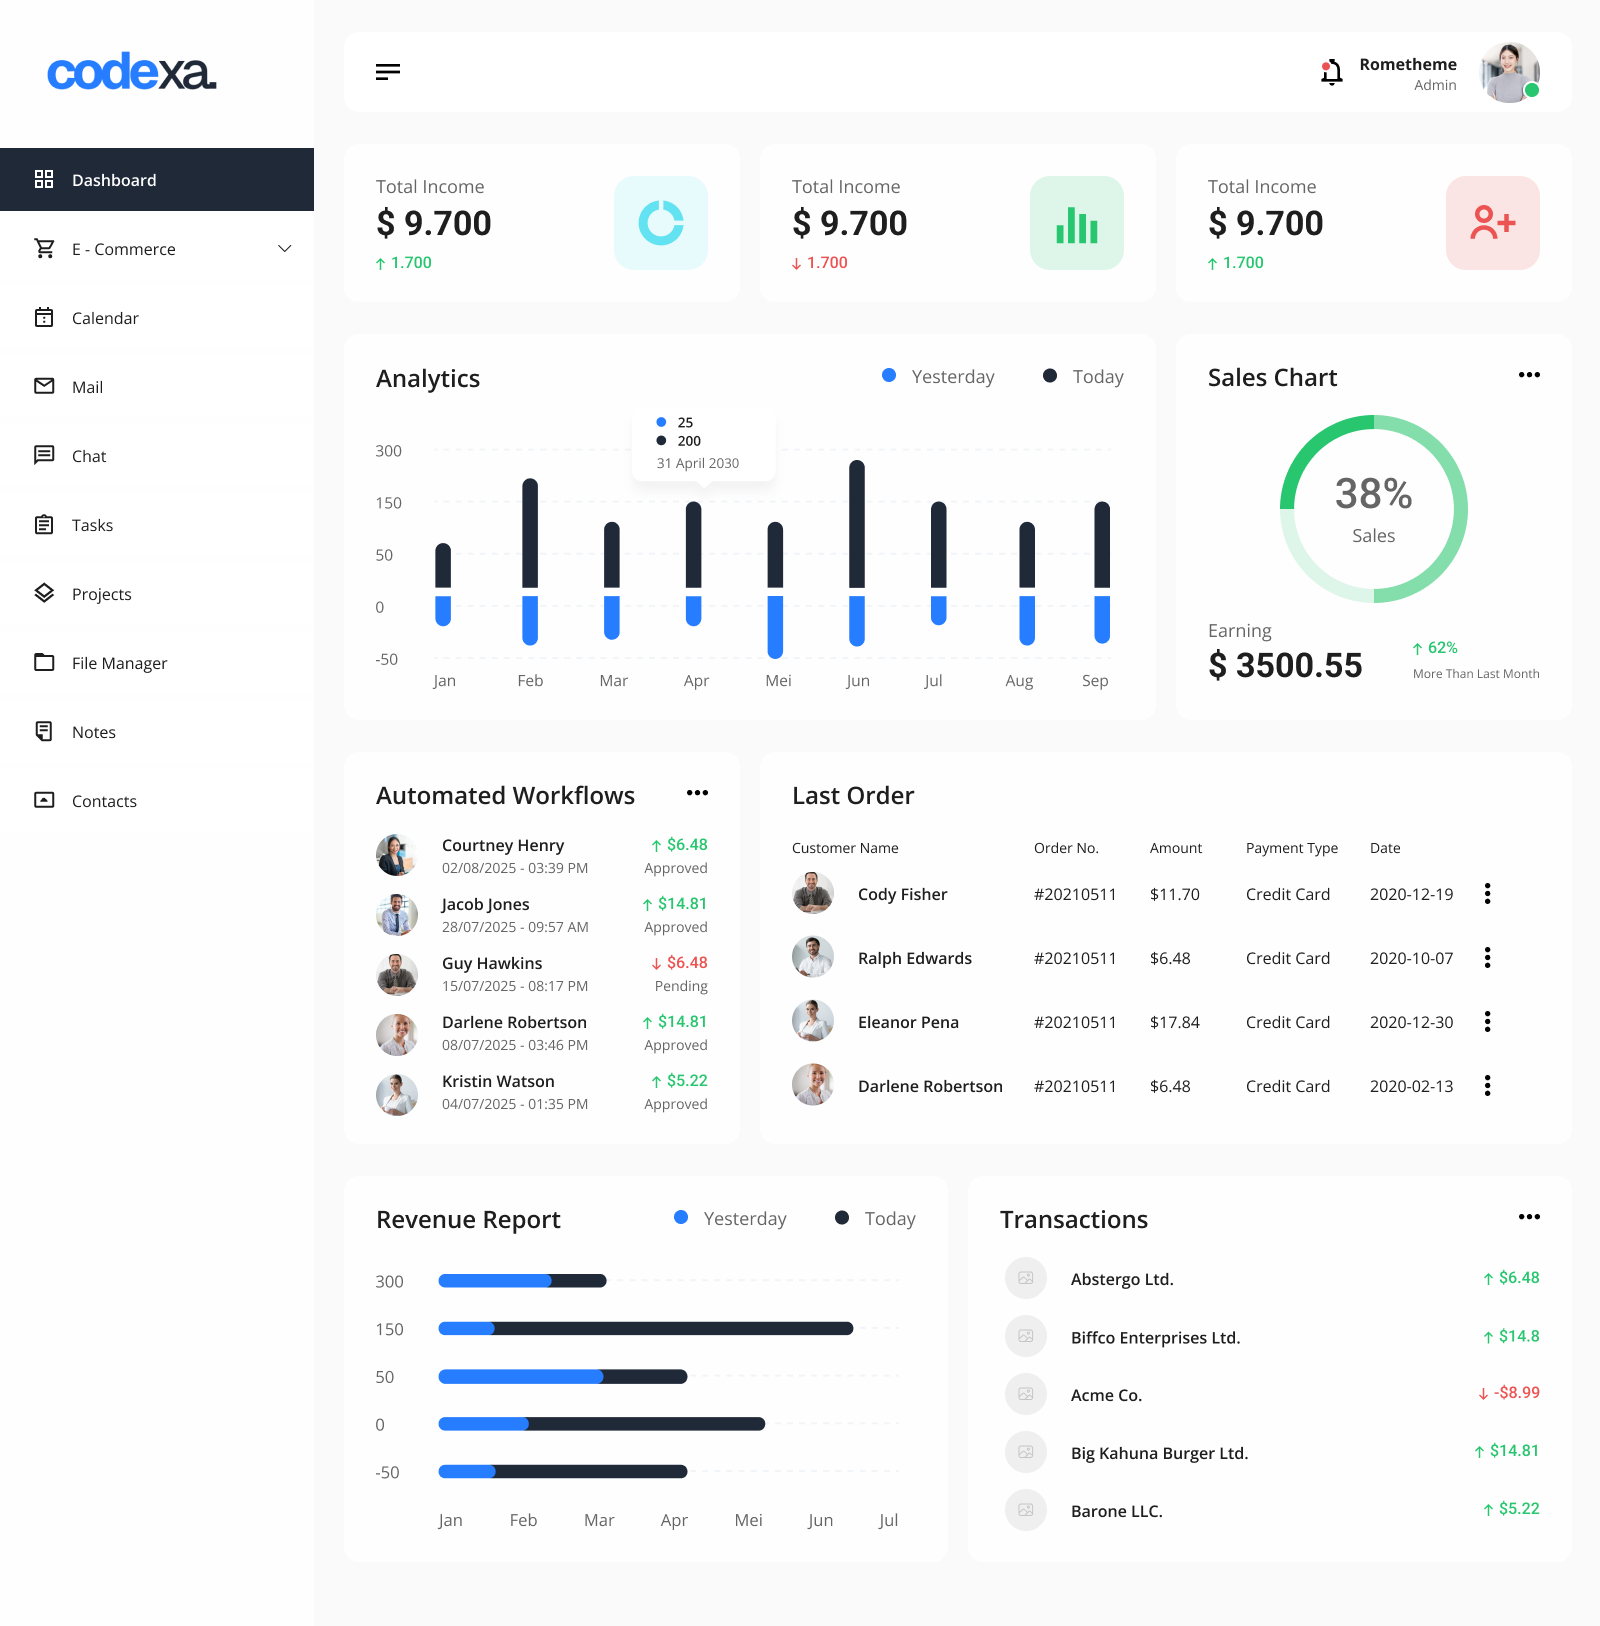
Interactive dashboards that stream real-time data — so you always know exactly what's happening in your business.
Real-Time Analytical Dashboard Development
Overview
Data is only valuable when it's visible and actionable. We build custom analytical dashboards that pull from your live data sources and present them in clear, interactive visualizations — giving your leadership, operations, and sales teams instant access to the numbers that matter most.
From simple KPI displays to complex multi-source BI platforms, we design and engineer dashboards that update in real time, support role-based access, and are accessible from any device. No more waiting for end-of-day reports — your data is live, visual, and always current.
What You Get:
Dashboards designed around your exact metrics — revenue, conversions, support tickets, delivery times, or whatever your business tracks.
WebSocket and event-driven architecture that pushes data updates live without page refreshes — your numbers update as they happen.
Connect to databases (MySQL, PostgreSQL, MongoDB), APIs, spreadsheets, cloud services, and BI tools into a single unified view.
Bar charts, line graphs, heat maps, funnels, gauges, and custom visualizations built with D3.js, Chart.js, or Recharts.
Different teams see different data — executives see company-wide KPIs, sales managers see pipeline data, ops teams see logistics metrics.
Key Benefits:
Live Data, Always Current
No refresh delays, no stale reports — data updates in real time as events happen across your business.
Role-Based Views
Executives, managers, and operators each see the metrics most relevant to their role — nothing more.
Any Device, Anywhere
Fully responsive dashboards accessible from desktop, tablet, and mobile — no app install required.
Multi-Source Data Fusion
Pull from databases, APIs, spreadsheets, and third-party tools and present it all in one unified view.
Custom Alerts & Thresholds
Get notified the moment a KPI crosses a critical boundary — before problems become incidents.
Exportable & Shareable
One-click PDF exports and shareable links make stakeholder reporting effortless and professional.
Why It Matters:
Data you can't see in time is data you can't act on. Most businesses are making decisions based on yesterday's numbers — weekly reports, manual exports, and stale spreadsheets that show what happened rather than what's happening right now.
In fast-moving industries — e-commerce, logistics, finance, SaaS — a one-hour lag in data visibility can mean missed opportunities, undetected anomalies, and costly late reactions. The organizations winning today are the ones making decisions in real time.
Qyzen Tech builds dashboards that turn your raw operational data into a live, actionable command center — giving every stakeholder the right metrics, at the right time, without having to ask for a report.
Result:
A live operational intelligence platform that transforms your raw data into clear, actionable insights — accessible to every stakeholder in your organization, on any device, at any time.
Decision-makers stop waiting for reports and start reacting to live signals. Teams get the visibility they need to move faster, catch problems earlier, and seize opportunities the moment they appear. Your data becomes your competitive advantage.
Tech Stack We Use:
Real Work, Real Results
Live Employee Movement & Attendance Monitoring System for a Production Factory
The Challenge
A manufacturing factory was tracking employee attendance with paper logs and punch cards — creating errors, enabling ghost attendance, and making it impossible for HR to generate reliable attendance and timing reports on a daily, weekly, or monthly basis.
Our Solution
We installed ZK Teko biometric devices (fingerprint, face scan, and card scan) at factory gates and built a desktop monitoring application that captures every entry and exit in real time. Each employee was issued a card linked to our system. HR can now generate per-employee attendance and timing reports — by day, week, or month — directly from the live dashboard.
Your Questions,
Clearly Answered
Everything you need to know about our Real-Time Analytical Dashboard services.